Plots
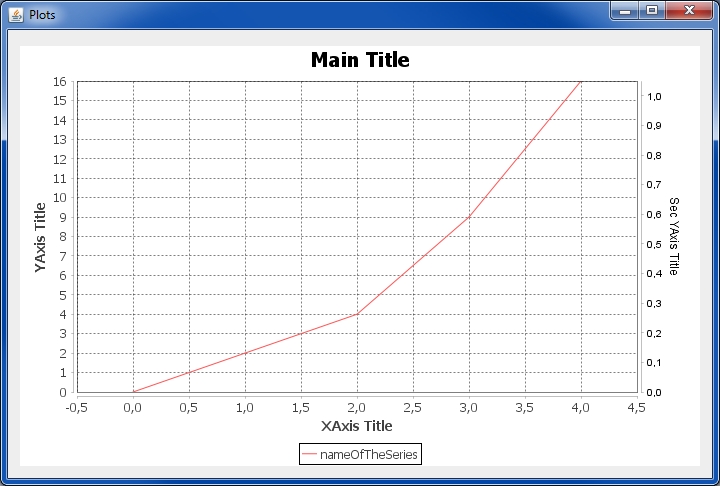
The way to plot inside a GPanel is very simple. These plots will be done thanks to JFreeChart product via the GFreeChartXY class.
First, we have just to instantiate a GFreeChartXY object like this:
  boolean addLegendFlag = true;
  GFreeChartXY plot = new GFreeChartXY("Main Title",
                                       "XAxis Title",
                                       "YAxis Title", "Sec YAxis Title",
                                        addLegendFlag);
Then, considering xVal and yVal, the both tables including the data to be plotted, we will add them to the plot object :
  double[] xVal = { 0., 1., 2., 3., 4.};
  double[] yVal = { 0., 2., 4., 9., 16.};

  boolean drawLines = true;
  plot.addSerie("nameOfTheSeries", xVal, yVal, Color.RED, null, drawLines);
At last, to display it in the current GPanel], we will use the put() method.
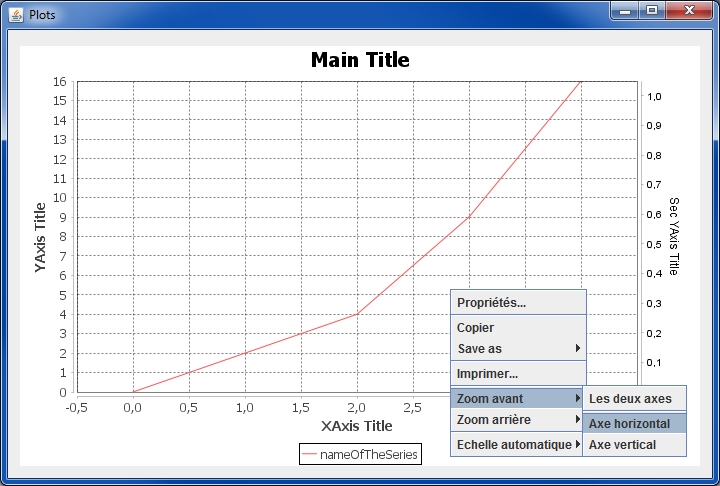
As we use JFreeChart, it is then possible to use all the functionnalities proposed by this product, specially by using the context menu obtained by clicking ont the right button of the mouse.

